Financial Ratios are the numbers you should be using to compare and assess the companies before investing in their stocks. Top Financial Ratios to Select Stocks include working capital, quick ratio, EPS (Earnings per share), P/E (Price to Earning) ratio, Debt to Equity Ratio and return on equity (ROE). These ratios when used in combination can help you to accept or reject the stocks of the companies when they are compared with the same industry stocks.
Let us understand Top Financial Ratios to Select Stocks in detail.
What are Financial Ratios in Stock Market?
- Financial Ratios are the math numbers we find using the data from financial statements of the company such as income statements, balance sheet and cash flow statement
- Not everyone can go through all the numbers in these financial statements and that is the reason some important financial ratios are first assessed and analyzed for a specific company and compared with other companies in same industry
- If these financial ratios meet the conditions of investor, he / she can further analyze the financial statements of that company to decide whether to invest in the stock or not
- Thus financial ratios play an important role in screening the stocks to invest in them
For an investor who is just a beginner in stock market, you should be knowing the financial ratio you should check before going further for deep analysis.
ALSO READ: What is Business Valuation
Top 6 Financial Ratios to Select Stocks in India
Below are some of the Best Financial Ratios to Select Stocks in India:
1. Working Capital
Working capital is defined as how capable the company is to pay off all the current liabilities from the cash it is having right now. This parameter can help us know if the company has enough cash to cover its next 12 months liabilities. If yes than the company is in good financial state and if not than the financial status of the company needs to be improved.
Below is the formula for working capital:
Working Capital = Current Asset - Current Liabilitieswhere current assets are the assets than include cash and other assets that be liquidated easily (can be sold easily to get cash) and current liabilities include short term debt and interest payments on borrowed capital that needs to be paid within next 12 months.
A financial healthy company should have a positive working capital and must sustain this number over a number of years.
For example, if current assets is Rs. 2 crore and current liabilities is Rs. 50 lakh, than working capital will be Rs. 1.5 crore which is a good financial condition of the company.
Similar to working capital, we also have working capital ratio that divides the current assets by current liabilities and below is the formula for working capital ratio:
Working Capital Ratio = Current Assets / Current LiabilitiesA good number for working capital ratio must be a positive number that is greater than one. If this ratio is less than one, than the company does not have enough cash to cover short term liabilities and might have to borrow more capital or raise funds.
Taking above example of Rs. 2 crore of current assets and Rs. 50 lakh as current liabilities, the working capital ratio will be 4, which is a good working capital ratio and indicates that the current assets can cover the current liabilities.
2. Quick Ratio
Quick Ratio is similar to working capital ratio but after removing inventory and prepaid expenses from the assets, since inventory cannot be liquidated easily. Below is the formula for quick ratio:
Quick Ratio = Current Assets - Inventory and prepaid expenses / Current LiabilitiesIn above formula, you need to subtract the inventory and other prepaid expenses first from current assets, and then divide this number by current liabilities.
A good quick ratio should be a positive number that is greater than One. Quick ratio which is less than one means company does not have enough cash to cover short term debt and interest payments which is not a good sign for a company.
ALSO READ: Zero Income Tax with Tax Rebate under Section 87A
3. EPS (Earning per share)
EPS full form is Earnings per share which is another important financial ratio to check while selecting stocks. EPS is defined as the net income or earnings divided be total number of outstanding shares of the company. This defines the earnings of the company per share of the company.
Below is the formula for EPS (Earnings per share) of the company:
EPS = Net Income / Total number of outstanding shares of the companySo based on above formula, if the net income of company is Rs. 1 crore, and the average number of shares of company is 1,00,000, than the EPS will be Rs. 100 (Rs. 1,00,00,000 / 1,00,000).
Like other financial ratios, EPS of a company must be compared with the companies in same industry for better analysis.
EPS can also be zero or negative, in which case the earnings of the company can be zero or negative which is not a good sign.
4. P/E Ratio (Price to Earnings)
P/E Ratio or price to earnings ratio defines how much price you need to pay to get Rs. 1 earnings of the company, and below is the formula of P/E ratio:
P/E Ratio = Stock Price / Earnings per share (EPS)In above formula, stock price of company changes with time due to which the P/E ratio also changes, where EPS is taken as the average EPS for the last 12 months. In this way the P/E ratio of the company changes everyday due to the changes in stock price.
P/E ratio is one of the important factors investors should look for, as it indicates how much price the other investors are will ing to pay to earn the earnings of the company. Stock with low P/E is considered to be undervalued where as the one with high P/E ratio is said to be overvalued.
The P/E ratio of the company can also rise if the company has the potential to grow in near future due to which other investors are investing in the company thus taking it’s stock price high.
P/E ratio can be negative if the earnings are in negative, in which case such companies must be avoided.
What is a good P/E Ratio?
Generally a P/E ratio of 15 or less is considered to be a good P/E ratio, lower the value, better the investment will be. But in some cases of growth stocks, the P/E ratio can go above 15 and still you will see investors are betting on such stocks due to the potential of their future growth. You should be comparing the P/E ratio of similar companies in same industry.
But the true fact is, there is nothing called growth stock since no company can grow it’s earnings to infinity with time. Ultimately, the stock price have to settle to a price that is reflected by various numbers in financial statements.
So the story of growth stock is attractive when the P/E ratio was below 15, but after this level, there is very less chance that the price of the stock will increase rapidly.
ALSO READ: Types of Equity Mutual Funds
5. Debt to Equity Ratio
Debt to Equity ratio defines the capability of company to cover the debt and interest payments using the shareholder’s equity. Lower the debt to equity ratio, better will be the investment.
Below is the formula for Debt to Equity ratio:
Debt to Equity = Total Liabilities / Shareholder Equitywhere total liabilities is the short term and long term debt of the company, where as shareholder equity is the amount collected from investors from share market.
So for example, if the total debt of the company is Rs. 1 crore and shareholder equity is Rs. 2 crore, than the debt to equity ratio will be 0.5, which is a good financial condition of the company.
A good debt to equity ratio is less than one, since this indicates that the total debt of the company can be covered by equity amount and even after that the company will be left with some amount to invest in other assets.
Debt to equity ratio above one is not a good financial condition of the company, but in this case the company should have a good interest coverage to cover for interest payments related to debt.
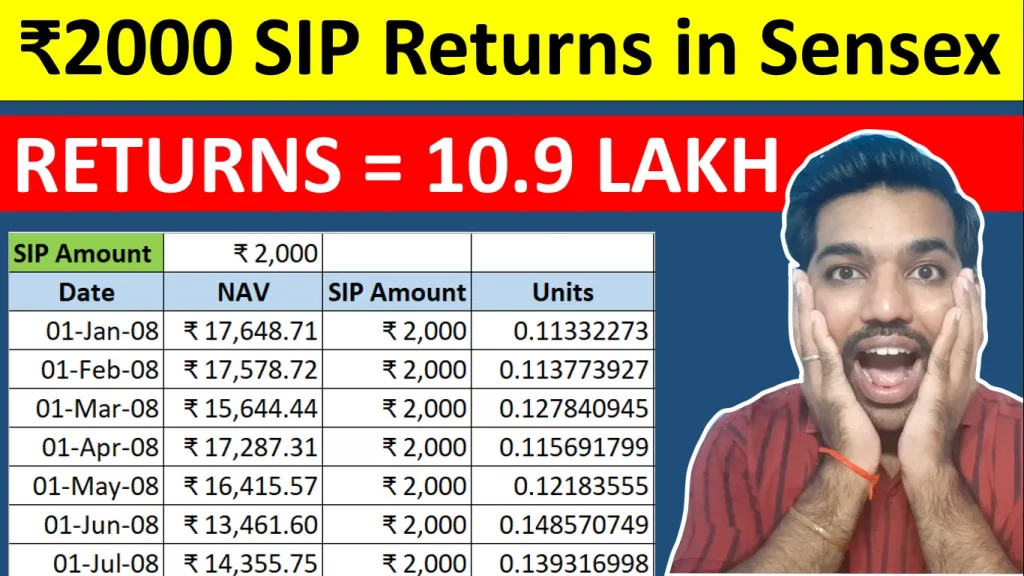
ALSO READ: Rs. 2000 SIP Returns in Sensex for 15 Years
6. Return on Equity
Return on Equity or ROE is the returns the company generate with the equity amount collected from investors. It is represented in terms of percentage.
Below is the formula for return on equity or ROE:
Return on Equity = Net Income / EquityIn above example, net income will be after removing expenses and taxes from the earnings and before paying the common share dividends, and equity refers to the shareholder equity amount.
What is a good ROE ratio?
A good ROE ratio will be the one that is positive and 15% or above. This means that the company is using the shareholder equity efficiently to make good returns out of the investing and operational activities.
Conclusion
So above are the Top Financial Ratios to Select Stocks in India. These are the financial ratios that you should be looking for before going in depth for further analysis of any company. Below is the list to summarize these financial ratios:
- Working Capital
- Quick Ratio
- Earnings Per share (EPS)
- P/E Ratio (Price to earnings)
- Debt to equity ratio
- Return on Equity (ROE)
Some more Reading:
Frequently Asked Questions
What is the best ratio to evaluate stocks?
There is no one best ratio to evaluate stocks. The evaluation and analysis of the company’s stocks depends upon multiple factors and ratios like working capital ratio, earnings per share (EPS), P/E ratio (price to earnings), debt to equity ratio, return on equity (ROE), and many more. So there is no one best ratio to evaluate stocks.
What are the ratios for stock selection?
Some of the best financial ratios for stock selection include working capital ratio, earnings per share (EPS), P/E ratio, debt to equity ratio and return on Equity (ROE).
What are the 5 most important financial ratios?
The 5 most important financial ratios in stock market include working capital ratio, earnings per share (EPS), P/E ratio, debt to equity ratio and return on Equity (ROE). Apart from these some more ratios include return on capital employed (ROCE), interest coverage, P/B ratio (Price to book), Return on sales, etc.
Save Home Loan Interest Amount!
Use Home Loan Excel Calculator that will help you to Save Interest Amount on Home Loan EMI.
Click below button to download Home Loan EMI and Prepayment Calculator in Excel:
Watch how Home Loan Calculator in Excel Works
Income Tax Calculator App – FinCalC
For Income Tax Calculation on your mobile device, you can Download my Android App “FinCalC” which I have developed for you to make your income tax calculation easy.
What you can do with this mobile App?
- Calculate Income Tax for FY 2025-26 and previous FY 2024-25
- Enter estimated Investments to check income tax with Old and New Tax Regime
- Save income tax details and track regularly
- Know how much to invest more to save income tax
- More calculators including PPF, SIP returns, Savings account interest and lot more

Use Popular Calculators:
- Income Tax Calculator
- Home Loan EMI Calculator
- SIP Calculator
- PPF Calculator
- HRA Calculator
- Step up SIP Calculator
- Savings Account Interest Calculator
- Lump sum Calculator
- FD Calculator
- RD Calculator
- Car Loan EMI Calculator
- Bike Loan EMI Calculator
- Sukanya Samriddhi Calculator
- Provident Fund Calculator
- Senior Citizen Savings Calculator
- NSC Calculator
- Monthly Income Scheme Calculator
- Mahila Samman Savings Calculator
- Systematic Withdrawal Calculator
- CAGR Calculator
I’d love to hear from you if you have any queries about Personal Finance and Money Management.
JOIN Telegram Group and stay updated with latest Personal Finance News and Topics.
Download our Free Android App – FinCalC to Calculate Income Tax and Interest on various small Saving Schemes in India including PPF, NSC, SIP and lot more.
Follow the Blog and Subscribe to YouTube Channel to stay updated about Personal Finance and Money Management topics.